
Air pollution kills an estimated 7 million people every year. Tiny soot and dust particles found in city air and biomass-fueled kitchens are the main culprits. Scientists call it PM2.5, meaning particulate matter smaller than 2.5 millionths of a meter. Bloomberg Green pulls data from more than 4,000 sensors monitoring PM2.5 in an open-source network run by OpenAQ, a nonprofit based in Washington, D.C.
In the most recent 24-hour period, at least 146 million people around the world lived with air exceeding the World Health Organization’s guideline of 25 micrograms of PM2.5 per cubic meter. That’s out of a total population of 502 million people living within range of air-quality sensors included in this sample.
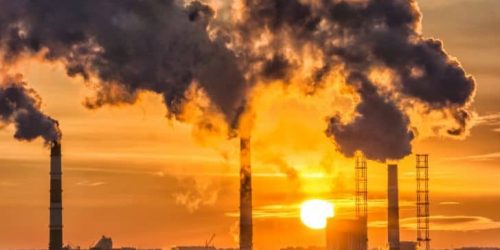
Particulate matter is in some ways the most intimate of the climate pollutants. It’s the result of activities people do every day. PM2.5 is made up of soot from vehicles, smoke and ash from wildfires, biomass cook-stove pollution—plus sulfate aerosols from power generation and desert dust. We breathe it in, particularly those of us living in cities and households in developing nations. No amount is safe, and exposure over time increases susceptibility to cardiovascular and respiratory illnesses. Scientists and public-health officials are much less concerned about daily levels, in which weather plays an outsize role, than they are about chronic exposure.
The chemical diversity of PM2.5 makes it hard to describe a single effect on the climate. One significant impact comes from black carbon, a sooty material caused by burning fossil fuel, which can settle on glaciers and attract solar radiation that would otherwise be reflected back into space. Black carbon at different altitudes can protect clouds, providing a cooling effect, or interfere with cloud formation, a warming effect. Another component of PM2.5, aerosols, has a cooling effect on temperature.
Many big cities monitor PM2.5 continuously, but the coverage is uneven within population centers and some of the most-polluted cities have few sensors. Oslo, Norway, is home to at least 12 such monitors in the OpenAQ database, while Lahore, Pakistan—which is 12 times larger—has only one sensor. This means there are nowhere near enough sensors to measure the air quality of the vast majority of the 7.6 billion people on the planet.
What progress looks like
Cleaner air has been a clear success for environmental policy. Public-health researchers long ago documented the link between PM2.5 and mortality, and policymakers have since come up with effective laws that reduce save lives. That means PM2.5 readings—and the number of people living with substandard air quality—can drop more rapidly than almost any other metric on this dashboard.
From 2000 to 2018, for example, PM2.5 pollution in the U.S. fell by almost 40%, to 8 micrograms per cubic meter, after the implementation of revised national air-quality standards. China has required people in heavily polluted areas to switch away from coal- to gas-fired power and declared low-pollution zones around major cities. India faces the most daunting current challenge, driven by coal power, urban transportation and farming practices that involve massive annual fires. Indian cities accounted for the entire top 10 list of most polluted in 2016, according to World Health Organization data. The good news is that cleaner technologies and better policies can rapidly sweep away air-quality problems.
Methodology
The air pollution metrics included in this Bloomberg Green graphic and Data Dash are based on the United Nations’ 2020 population projections (as of 2018), which cover about 1,800 large urban areas with more than 300,000 residents each, and thousands of active air quality sensors worldwide measuring small-particulate pollution (known as PM2.5) tracked by OpenAQ.org.
For every urban center’s midpoint latitude and longitude as assigned by the UN, Bloomberg queried the OpenAQ.org API for any PM2.5 readings within 10 kilometers over the 24-hour period preceding each update. This timeframe and coverage area was selected after consulting with several air-quality experts to reasonably control for temporary volatility in meteorological or other conditions.
The data are then filtered to exclude urban areas with less than three working sensors, any negative readings and error messages. For the most recent data update (Mar. 20, 9 AM), the resulting sample covers 196 cities in 55 countries, with a combined projected population of over 502 million people in 2020, representing 6% of a projected global population of 7.8 billion.
A 24-hour median is then calculated for each city, to determine the place with the highest PM2.5 level and the minimum number of people living in cities with a PM2.5 level above the World Health Organization’s 24-hour guideline of 25 micrograms per cubic meter. If more than one city shares the highest median PM2.5 level for a given 24-hour period, the city with the greater projected 2020 population is used.
Long-term air-pollution data come from the Global Burden of Disease Study, which was published most recently in The Lancet in 2018, in these two papers.