
Amid its massive increase in energy demand, Southeast Asia has pledged to increase its use of renewable energy by up to 23% by 2025. Geospatial technology approaches that integrate statistical data, spatial models, earth observation satellite data, and climate modeling can be used to conduct strategic analyses for understanding the potential and efficiency of renewable energy development. This study aims to create the first spatial model of its kind in Southeast Asia to develop multi-renewable energy from solar, wind, and hydropower, further broken down into residential and agricultural areas. The novelty of this study is the development of a new priority model for renewable energy development resulting from the integration of area suitability analysis and the estimation of the amount of potential energy. Areas with high potential power estimations for the combination of the three types of energy are mostly located in northern Southeast Asia. Areas close to the equator, have a lower potential than the northern countries, except for southern regions. Solar photovoltaic (PV) plant construction is the most area-intensive type of energy generation among the considered energy sources, requiring 143,901,600 ha (61.71%), followed by wind (39,618,300 ha; 16.98%); a combination of solar PV and wind (37,302,500 ha; 16%); hydro (7,665,200 ha; 3.28%); a combination of hydro and solar PV (3,792,500 ha; 1.62%); and a combination of hydro and wind (582,700 ha; 0.25%). This study is timely and important because it will inform policies and regional strategies for transitioning to renewable energy, with consideration of the different characteristics present in Southeast Asia.
Introduction
Under Sustainable Development Goal 7, many countries have agreed to increase and distribute renewable energy sources, which made up only 11% of the total global energy supply in 20201,2. With the global energy demand expected to increase by 50% between 2018 and 2050, strategies to increase the number of renewable energy sources to meet future energy demands have become more important than ever. Countries in Southeast Asia have been experiencing rapid economic and demographic growth over the last few decades, which has led to soaring energy needs. Unfortunately, fossil fuels account for more than half of the region’s energy supply3. Southeast Asian countries have committed to target a 23% increase in renewable energy by 20254. As areas that receive sunlight year-round and are dominated by numerous islands and mountains, countries in Southeast Asia have great potential for renewable energy. However, the main challenge in developing renewable energy is finding areas with high suitability for developing the infrastructure needed for sustainable power generation5. In addition, regulatory certainty, stable political and administrative coordination, thorough planning, and the identification of mature land constraints are needed to ensure that the energy tariffs in different regions are valued appropriately. Strategic renewable energy sources that have been developed in recent decades in the region include solar, wind, and hydropower. These sources have promising prospects for large-scale development to meet the region’s renewable energy targets4 as well as to distribute energy to areas that do not yet have electricity6. Owing to the potential and constraints of developing sustainable energy infrastructure in Southeast Asia, a strategy is needed to identify the optimal locations for sustainable energy development in the region, for which this study seeks to contribute.
Remote sensing technology integrated with spatial analysis has been widely used to support decision making to determine the optimal locations for renewable energy infrastructure7,8,9. For example, to determine the optimal solar area, Lopez et al.10 used the MODIS remote sensing product to model solar radiation. Letu et al.11 estimated the values of surface solar radiation, clouds, and aerosols from Himawari-8 satellite measurements. Furthermore, Principe and Takeuchi12 conducted an assessment of potential solar photovoltaic (PV) energy in the Asia–Pacific region based on meteorological factors. After identifying the potential areas for solar energy using remote sensing, it is possible to select the areas with the highest optimal values for the construction of solar power infrastructure. In addition, spatial analyses have been conducted based on a multi-criteria approach related to solar PV placement13,14,15. For wind farms, Blankenhorn and Resch16 estimated the locations for potential wind energy in Germany based on the parameters of wind speed, land cover, slope, and protected area locations. Sah and Wijayatunga17 modeled the potential regions in Bali, Indonesia, by integrating wind speed data from MODIS and physical infrastructure parameters; they produced a map of the potential wind energy distribution and the amount of power that could be generated. To identify areas in Iran with the potential for wind power plants, Noorrollahi et al.9 conducted a case study that successfully integrated multiple criteria analysis methods involving physical and environmental aspects. Furthermore, several development-related studies have focused on modeling the potential of hydro-energy. Korkovelos18 compared two LISFLOOD hydrological models with their own model that used data from the Global Runoff Data Center (GRDC) and digital elevation model (DEM) observation stations. Additionally, Rojanamon19 conducted a review of the physical, environmental, and economic aspects of achieving hydropower energy development.
Some studies have modeled multiple energy sources to determine their combined potential for maximizing energy production.17 Wang et al.20 conducted spatial modeling of the potential for solar, wind, biomass, geothermal, and hydropower energy in Fukushima, Japan, resulting in a map of the combined renewable energy potential. Asadi and Pourhossein21 conducted research in eastern Azerbaijan using technical, economic, and environmental data to determine the areas suitable for the construction of solar and wind power plants. Moreover, Yeom et al.22 used the COMS MI satellite to determine the spatiotemporal distribution of potential solar and wind energy resources over North Korea. Other studies23,24 mapped hydro-solar-wind energy potential in West Africa and developed an optimally designed system of renewable energy resources based on the region of South and Central America. Previous studies have mapped multi-renewable energy sources by considering physical, social, and economic parameters. However, there has not yet been any research on this topic covering the Southeast Asian region as a whole and considering both a land suitability analysis and an estimate of the total potential energy produced.
There are many factors limiting the relevant research in this area. One reason is the changing dynamics of the weather, which can influence the available solar, wind, and hydro energy. Investigating weather changes either diurnally or seasonally is challenging because it requires observation tools with high temporal and spatial resolutions. For example to observe solar radiation and wind conditions which are location-dependent and greatly fluctuating, a high density of solar and wind observation sensors are necessary. Satellites equipped with a scatterometer to observe wind vectors, such as QuikSCAT (QSCAT), have low spatial and temporal resolutions; in the case of QSCAT, the spatial resolution is only 0.25° × 0.25° and the temporal resolution is only 3 days, making the satellite usable only in the ocean25. The new generation of satellite-scatterometers, named Advanced Scatterometers (ASCAT), has similar capabilities but with improved spatial resolution26. Therefore, it is necessary to develop studies for planning the optimal location for solar PV, windfarms, and hydropower stations that can support the efficient deployment of energy. In addition, it is necessary to develop the potential produced energy with consideration of various meteorological factors, which are all strongly influenced by weather conditions.
The limited number of observations has caused there to be no studies considering seasonal factors in modeling the optimum energy for solar, wind, and hydro energy. Therefore, this study aims to evaluate solar, wind, and hydro energy across the entire region of Southeast Asia. The objectives of the study included modeling the energy needs of urban and rural areas, determining the level of suitability for multi-renewable energy production, and calculating the total estimated energy potential of multi-renewable energy. The integration of dominant energy probabilities for solar, wind, and hydropower in urban and agricultural areas, which we believe to be the first attempt in the field, is also discussed. This study also creates a new model that integrates the energy requirements of the study area with its suitability for energy production, accompanied by an estimate of the amount of potential energy that can be generated. The results of this study are expected to be used by multi-level governments in the region as well as the private sector to inform energy and spatial planning policies and strategies to prioritize and accelerate the energy transition in Southeast Asia based on different regional characteristics.
Results
Spatial distribution of estimated urban and rural energy demand
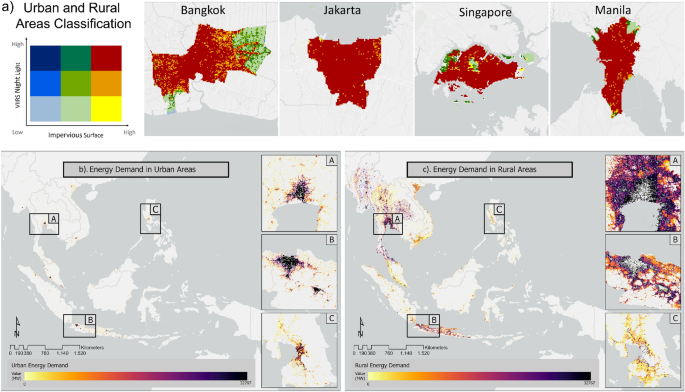
In the analysis of the energy demand of Southeast Asia, the study area was divided into two land cover classes: urban and rural. In this study, the classification for these two land cover classes was created by combining nightlight and impervious surface data. Figure 1a depicts that the obtained land cover class can represent the urban class in selected four Southeast Asian capital cities. In addition, Table 1 shows the percentage distribution of urban and rural land cover classes in each of the six cities: Bangkok, Thailand; Hanoi, Vietnam; Jakarta, Indonesia; Kuala Lumpur, Malaysia; Manila, Philippines; and Singapore, Singapore. The cities were found to have the High (night light)–High (impervious surface) class as the majority, which was represented as urban area. The total consumption was calculated for a coverage area of 100 × 100 m in kilowatt-hours. Figure 1b,c show the distribution of electricity consumption in urban and rural areas in Southeast Asian countries. The dark shade indicates areas with more energy consumption; almost all urban areas with a high population density are displayed in red. The areas with low consumption are indicated in blue. The value of average electricity consumption per capita in urban areas was 10% higher than that in rural areas. The results showed that Indonesia had the highest total energy consumption, with a total electricity consumption of 212,747 GWh in 2020. The country with the lowest total electricity consumption was Timor Leste at 124 GWh. The comparative analysis of total electricity consumption between urban and rural areas showed that seven countries (Indonesia, Thailand, Vietnam, Myanmar, Brunei, Cambodia, and Laos) had higher total electricity consumption in rural areas compared to urban areas due to the higher proportion of rural areas. The areas around the capital cities Jakarta, Bangkok, and Manila were selected to approximate the energy consumption in the urban centers.